Soil samples indicate soil nutrient reserves available for crop uptake. This is useful any year, and especially after low-yielding or high-yielding years when reserves may be more difficult to predict. Test results will help farms set fertilizer rates specific to the needs and yield potential of each field – a key step in implementing the right rate principle of 4R Nutrient Stewardship practices.

Timing
Soil sampling just prior to seeding provides the most accurate measure of nutrients available to the crop, but this timing has practical limitations. Results may not come in time. And spring can be tough to get representative cores due to soil moisture conditions.
Late fall soil sampling can be almost as accurate and has various advantages: less time pressure to get samples collected and analyzed, especially if done after harvest; more time for fertilizer planning, including variable rate prescription maps; and the opportunity to buy the right amount of fertilizer at a lower price. (Prices are often, but not always, lower in the fall.)
- Fall timing for next year’s planning. Sampling after soil has cooled to below 10°C reduces the microbial activity that can mobilize nutrients. Soil samples collected after this activity slows down will more closely reflect spring nitrate (NO3–) contents. If farms plan to band fertilizer in the fall, sampling when soils drop to 10°C (not too much lower) should allow for fall application before the ground freezes. If not planning fall applications, sampling can occur close to freeze up – as long as probes can extract good cores.
- Fall timing to assess this year’s fertilizer program. Sampling immediately after combining may show what nutrients, if any, were deficient for the current year’s crop and help plan for better results in next year’s crop.
Technique
Composite samples
One composite sample per field can provide a general impression of soil nutrient levels. This result is suitable to set a blanket nutrient rate for the whole field. It cannot account for the high degree of nutrient variability across a field. For the composite:
- Take 15-20 sub-samples from the typical or “average” areas – usually mid-slope positions. Avoid areas where productivity varies considerably from the field average – ex. hill tops, low or saline areas, old manure piles, field edges, etc.
- Some soil testing companies measure topography, salinity and textural changes within the field, and use that to select sample locations. For more conventional soil testing services, farmers should provide soil samplers with a map of recommended sampling sites or areas to avoid sampling. In Saskatchewan, SKSIS Mapper can create soil sampling maps.
- Divide each core into two or three soil depths and put them into separate pails.
- Suggested depths are 0-6” and 6-24” (or a three-way split of 0-6”, 6-12” and 12-24”). With the 0-6” sample, analyze for everything, including macronutrients (e.g., N, P, K, S), micronutrients, and the standard non-nutrient measurements (e.g., soil organic matter, carbonates, soil pH, and salinity). With the 6-24″ sample, one could analyze everything again or select only nitrate-N, sulphate-S and, perhaps, chloride as they are quite mobile and crops can take up these nutrients easily, even with their low density of deep roots. Also, sample and analyse for soil pH and salinity.
- With the 15-20 sub-samples separated by depth, blend those samples to create one composite sample per depth.
- Submit each depth in its own sample bag.
The benchmark composite. Farms could GPS-locate one “average acre” in the field and use that pin as a sample point each year. This can provide for more accurate comparison of samples year after year and is faster for the sampler. If using a benchmark location, farmers should participate in choosing that spot.
Add one or two targeted samples
Farms could advance their composite sampling program by submitting separate samples from additional target areas – hill tops, low spots, saline patches, area with lodged crops. An extra one or two targeted samples can identify fertilizer issues that would not show up in the single composite. Some scenarios:
- An area always subject to lodging may have high organic matter and the extra nitrogen kick causes lodging. It may be possible to reduce nitrogen applications in that area.
- Hill tops can be low in sulphur. If a composite sample from hill tops shows low sulphur, farmers could spread extra sulphur on a few hills. Note that canola has relatively high sulphur demand.
- Low yielding areas may have many reasons for low performance, and a targeted sample could identify those reasons. It could be something relatively easy to manage, such as low potassium. A targeted application could boost yield results, saving the productivity of acres that were not benefiting from the blanket application.
- In-season targeting. Targeted sampling (soil and tissue) could identify in-season issues that could be solved with a targeted top dress. Take samples from the problem areas and compare them to samples from healthy-looking areas within the same field. By comparing results, major differences can point to the potential cause of the poor growth or lodging. If results are similar, the cause may not be nutrient related.
Precision sampling
Farmers and agronomists know that fields have variable levels of productivity. Some farmers are taking steps to manage that variability and increase overall profitability in a field. Identifying variability often relies on a lot more samples per field. Farmers and agronomists interested in precision management can reach out to experienced advisers who will identify productivity zones in each field based on soil characteristics, drainage, topography, salinity and more. They use precision-targeted soil testing to create prescription maps for variable-rate fertilizer applications. Read The path to variable (optimum) rate application
Cost
Custom sampling in two parts (0-6″ and 6-24″) and lab analysis of that two-part soil sample will cost around $100. Cost per sample will be lower when a farm submits more samples. At $1 or less per acre, soil sampling will pay off if farmers use results to make more refined fertilizer rate decisions.
Interpretation
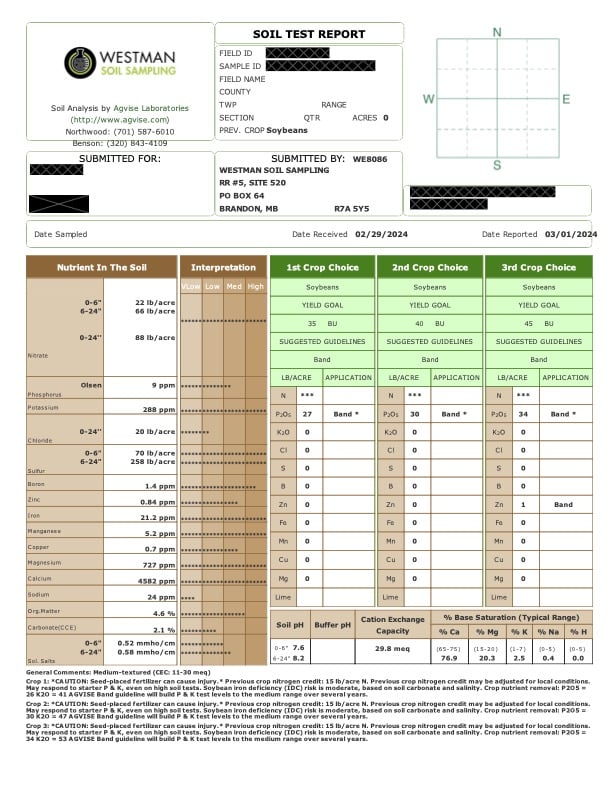
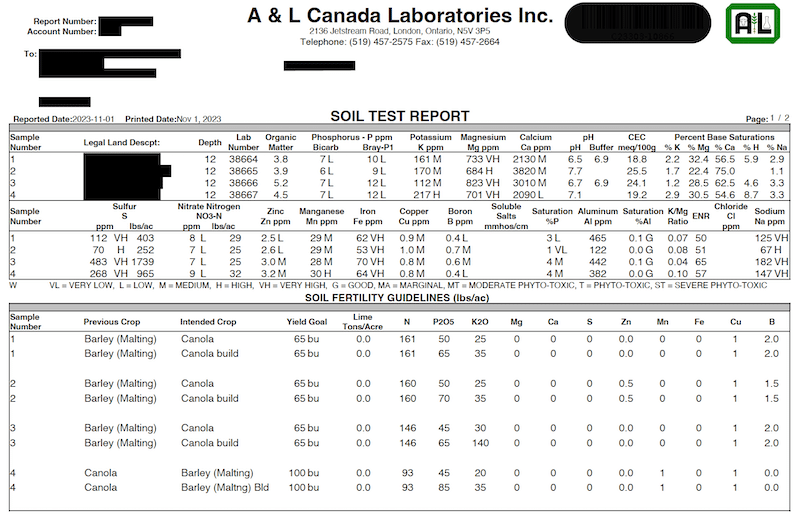
Soil test results from labs will include soil characteristics, actual soil nutrient levels and fertilizer rate guidelines based on the crop and target yield.
Canola needs, on average, 2.4 pounds of nitrogen, 0.9 pounds of phosphorus, 2.9 pounds of potassium and 0.9 pounds of sulphur per bushel. If the target yield is 50 bu./ac., multiply these nutrient numbers by 50 to get the crop need. Important: These are averages. The ranges are very wide, which is the challenge with rate recommendations. Long-term soils test results paired with yield data can help improve these recommendations. That is why farmers may want to develop their own rate recommendations with their local agronomist based on yield potential, fertilizer prices, crop budgets and their own risk tolerance.
Soil reserves will supply some of that need, which is why the soil test is useful. The rest will come from fertilizer or mineralization.
The following interpretation tips come from Rigas Karamanos, Marla Riekman, Don Flaten and John Heard, who worked together on a soil test interpretation forum.
Non-nutrient measurements to watch
Carbonate (calcium carbonate equivalent/CCE)
One of the greatest problems with carbonates is that they inhibit iron uptake, which increases the risk of iron deficiency chlorosis (IDC) in soybeans and flax, especially if the soil is also saline. AgVise guidelines for IDC risk.
Organic matter
If steadily going up over the long term, your soil quality is probably improving, but keep in mind that organic matter measurements vary from one sampling year to another depending on small changes in sample locations and sampling depth.
pH
If soil has very low pH(<5.5), it may benefit from lime treatment. Tips to increase soil pH for crop nutrition and clubroot
Lime:
- Reduces aluminum (Al) and other metal toxicities
- Improves the physical condition of the soil
- Stimulates microbial activity in the soil
- Increases CEC in variable charge soils
- Increases availability of several nutrients
- Supplies calcium to plants. Some sources supply magnesium
- Improves symbiotic N fixation in legumes
- Improve crop yields
Macronutrients
In general, know the nutrient needs of the upcoming crop and make sure nutrient levels (through soil reserves and fertilizer) are enough to meet target yields. Soil test companies will often provide guideline rates based on the crop and target yield indicated.
Nitrogen
Canola has a large nitrogen (N) requirement and soil tests will indicate the need relative to yield targets.
Loss risk. Fall application is risky in areas of a field (or of the Prairies in general) where spring moisture is high and standing water is common. In a wet spring, waterlogged areas of a field can lose two to four pounds of nitrate-N per day to denitrification. Likewise excessively drained, coarse textured soils may have nitrate leaching below the root zone. In such excessive moisture conditions, the fall soil test may overestimate the nitrate-N available. In such cases, spring re-testing may be warranted and supplemental nitrogen applied.
Mineralization. Crop nutrition experts who provided their insights for this article are reluctant to bank on any amount of mineralization. Soil test labs do not include an interpretation for mineralization of nitrogen from organic matter. Mineralization is highly variable year to year and spot to spot within a field. Soil with low organic matter and low moisture will provide minimal mineralized nitrogen. Soil with high organic matter and ample moisture could, possibly, provide a large percentage of the required nitrogen in a given year. In general, soil can generate six to 30 pounds of available nitrogen per acre for each percentage point of organic matter. However, the same organic matter the provides mineralized nitrogen can also tie up nitrogen through immobilization. And if growers bank on mineralized N as a nutrient source, and reduce recommended rates accordingly, the soils will lose organic matter and continue to degrade.
Phosphorus
Large pools of phosphorus (P) in the soil will churn out new plant-available phosphate each year. BUT our crops’ early season access to soil P is restricted by cold soils and slow root development. Therefore, applying modest rates of “starter P” fertilizer in or near the seed row is often recommended. As for full replacement rates or soil-test recommended rates, it may be possible to coast on this source in a year when profitability is tight and P fertilizer costs are abnormally high. However, this may not be a wise strategy in fields with very low or low soil test P. In general, P levels in many Prairie soils have been going down over time. Fertilizer rates that match crop removal, at a minimum, are the recommended long-term practice if your soil test P is in the low or medium range.
Potassium
Potassium (K) deficiency is not usually a problem for canola and most other Prairie crops unless soil tests levels are below 100 ppm. Cereals are more likely than canola to show a response to K fertilizer. For K-sensitive crops such as corn and potatoes, K fertilization is recommended at soil test levels less than 200 ppm.
“Right place” tip: Soil holds K quite strongly and early season access by the crop is restricted by cold soils and slow root growth. Therefore, K banded in or near the seed row can be up to 6 times more efficient than broadcast K.
Soybeans in rotation: Soybeans take up a lot of P and K. Growers with soybeans in the rotation with canola will want to monitor for trends in P and K fertility, but don’t expect soil test P and K levels to just fall quickly off a cliff. Change will be incremental over time.
Sulphur
Sulphur is moderately mobile in the soil and canola needs more sulphur than most other crops, which is why annual tests for sulphur are particularly important. S deficiency can be common in sandier soils (low OM, leaching) but soil scientists have also observed S deficiencies on black clay soils for the last 40 years.
“Right source” tip: If using elemental S, leave it on the surface to break down the granules. Elemental S must be converted to sulphate by microbial activity to make it available. And keep in mind most of that sulphur might not be available to next year’s crop. Elemental sulphur should be used with reasonable expectations for availability, and is best used in a long-term program.
“Right rate” tip: With sufficient S applications on canola, you can “coast” on other crops because decomposition of canola crop residues releases S.
Micronutrients
Micros to watch on the Prairies:
Boron
Yield responses to boron are very infrequent in Prairie soils and soil tests for boron have not been reliable for predicting boron deficiency. Crop can show a response to boron fertilizer if organic matter is 10 per cent or more, or if soils are very sandy. Otherwise research shows no or very low response to boron fertilizer.
Zinc
Apply zinc for corn if soil levels are below 1.0 ppm, and for edible beans if soil test levels are below 0.5 ppm. (That’s from research in Manitoba: T.B. Goh and R.E. Karamanos, 2004. “Zinc Responses of Dry Beans in Manitoba.” Canadian Journal of Plant Science 84, 213-216.) Pulses may show some response to zinc on very sandy soils. Also, be aware of eroded knolls that contain high levels of lime can lead to zinc deficiencies in crops.
Copper
The general recommendation is to apply copper in sandy soils with soil test results below 0.5 ppm. Rigas Karamanos says “We have identified 5.5 million acres in Western Canada with potential copper deficiency.”
New soil analysis tools
Soil scanners and probes use spectroscopy (absorption and emission of light) to provide automatic in-field analysis. Experienced agronomists recommend caution as these tools are expected to provide a high level of inference based on a relatively quick scan. Labs use techniques refined over decades to identify nutrient content at parts per million. If you choose to use this new technology, establish benchmark samples using your previous lab, to ensure analytical consistency and repeatability. Perhaps start with a few fields, then expand your testing once you are comfortable with the results and have established a reliable trend.
More…
- Canola Encyclopedia on soil sampling techniques
- Manitoba Agriculture’s Soil Fertility Guide
- How much fertilizer does canola need?
- Soil sampling as a step toward improved land use
- 4R Nutrient Stewardship practices
- Soil tests can help producers optimize fertilizer rates and improve profitability (Canola Research Hub blog)
- Nature and management of salt-affected land in Saskatchewan
- Three fertilizer tests to lower your risk