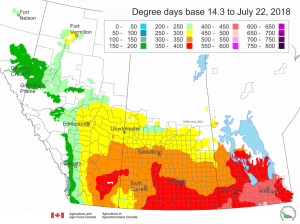
The Prairie Pest Monitoring Network also tracks Culex tarsalis, the mosquito that carries West Nile virus. Read the last PPMN update on this topic, including notes from Health Canada on West Nile virus. The map below shows the regions most advanced in degree-day accumulations for Culex tarsalis. Areas highlighted yellow then orange are approaching sufficient heat accumulation for mosquitoes to emerge. Culex tarsalis is already flying in areas in red. Wear DEET to stay protected!
Home / Canola Watch / Map of the Week – West Nile
Related Articles
Map of the week
This map from Agriculture and Agri-Food Canada shows the regions where growing degree days (Base 7°C) have reached sufficient levels to trigger emergence of bertha armyworm adults from pupae. Adults…
Discolored petals
Orange: Canola petals can turn orange in response to stress, usually heat stress. There is nothing that can be done about heat damage. White or pale flowers can have many…
Map of the week
The areas in orange and red have had the most days with maximum temperatures of 28°C or above in July. These hot days can cause higher levels of flower abortion,…
Map of the Week – Soil moisture
Soil moisture as of August 31 was lower than average for many parts of the Prairies. Red areas are the lowest, followed by orange and yellow.) The situation may have…