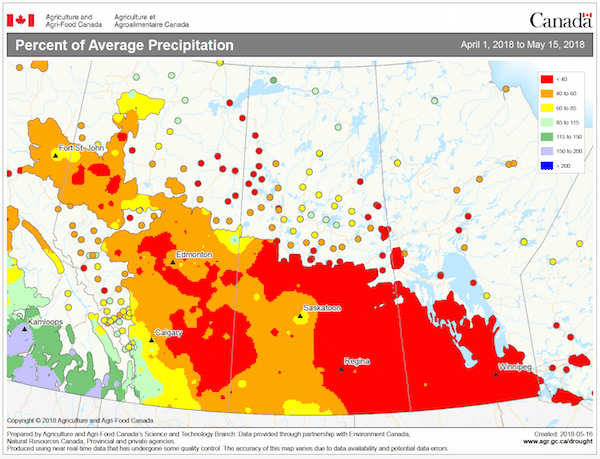
This map shows percent of average precipitation for April 1 to May 16, 2018. Areas in red have less than 40% of average. PDF version of map
Find this map and more at the AAFC AgroClimate Maps site.
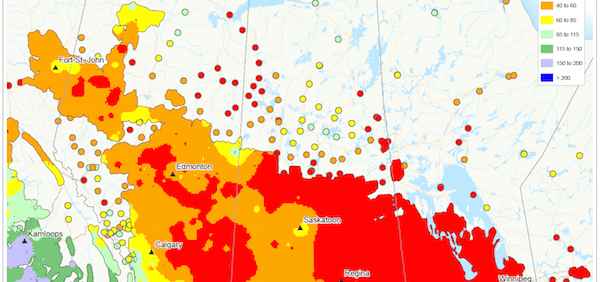
This map shows percent of average precipitation for April 1 to May 16, 2018. Areas in red have less than 40% of average. PDF version of map
Find this map and more at the AAFC AgroClimate Maps site.