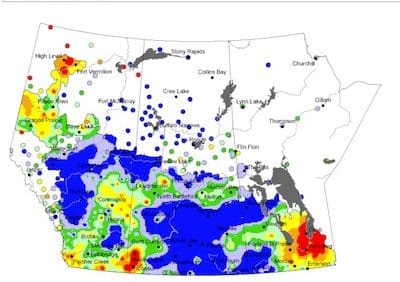
We have two maps from AAFC’s Drought Watch site showing rainfall as a percent of normal. The top map is for the week of May 27-June 2 and the second is for June 4-10. Quite a difference.
Home / Canola Watch / Map of the week
Related Articles
Moisture: What a difference two weeks make
The following two maps from AAFC show precipitation as a percent or normal for April 1-May 16 and April 1-May 30. Click the image to enlarge. These maps are sourced…
Map of the Week
Here are two WeatherFarm maps. Click the map for a link to the original on the WeatherFarm site. The frost map (top) is for yesterday morning. Many areas that had…
Map of the Week
This map shows percent of average precipitation for April 1 to May 16, 2018. Areas in red have less than 40% of average. PDF version of map Find this map…
Map of the Week – Lows
A few areas of the Prairies had a light frost over the past week. A light frost is not usually enough to warrant a change in harvest plans. Read the…