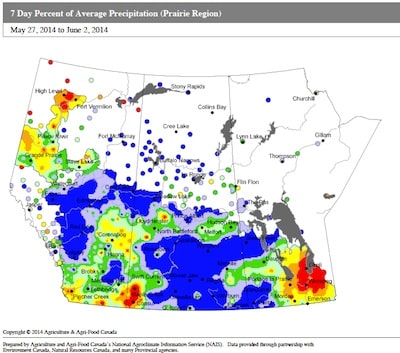
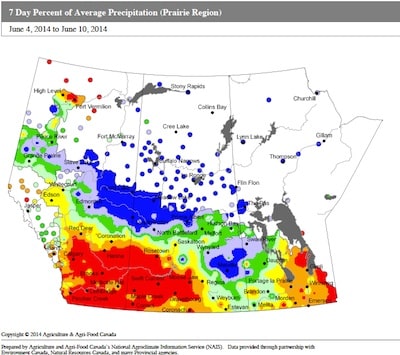
We have two maps from AAFC’s Drought Watch site showing rainfall as a percent of normal. The top map is for the week of May 27-June 2 and the second is for June 4-10. Quite a difference.
We have two maps from AAFC’s Drought Watch site showing rainfall as a percent of normal. The top map is for the week of May 27-June 2 and the second is for June 4-10. Quite a difference.
Subscribe to Canola Watch and get the latest canola agronomic information delivered to your inbox weekly during the growing season.
Keep the conversation going. Ask a follow up question to an article, ask something new, or give us your feedback.
Follow Canola Watch as another way to get the latest canola updates.
Videos related to Canola Watch
Canola Watch Podcast
Past Canola Watch Issues
Canola Watch Resources
Canola Watch Quizzes